Excel Filter – A Step by Step Guide
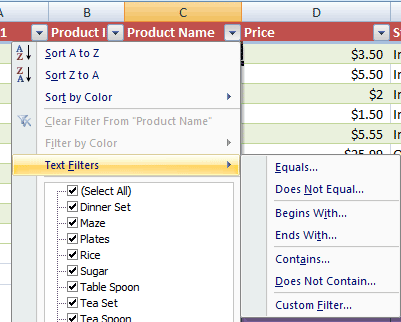
Thanks to Excel built-in functionality, you may filter data and return only desired rows or columns by certain criteria.
Thanks to Excel built-in functionality, you may filter data and return only desired rows or columns by certain criteria.
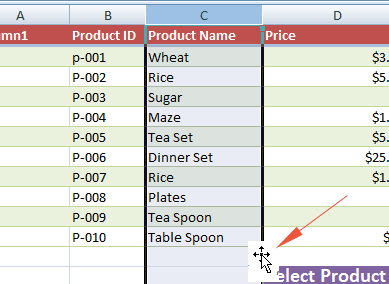
In simple terms, moving the rows and columns in Excel is just the matter of copy and paste or pressing the short keys Ctrl + X and Ctrl + P, that you might already used too while working in Excel, MS Word or other programs.
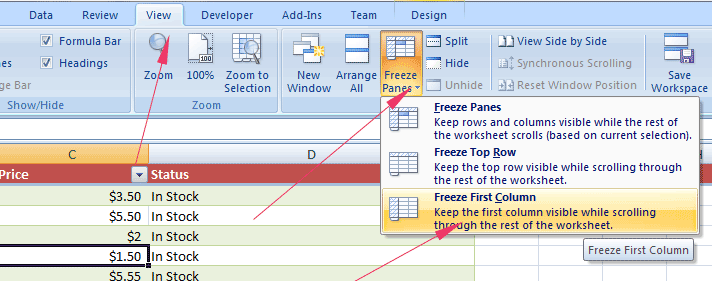
In Excel, freezing the first column (the left most) is pretty easy. Similarly, freezing two or more columns is easy that I will show in this tutorial.
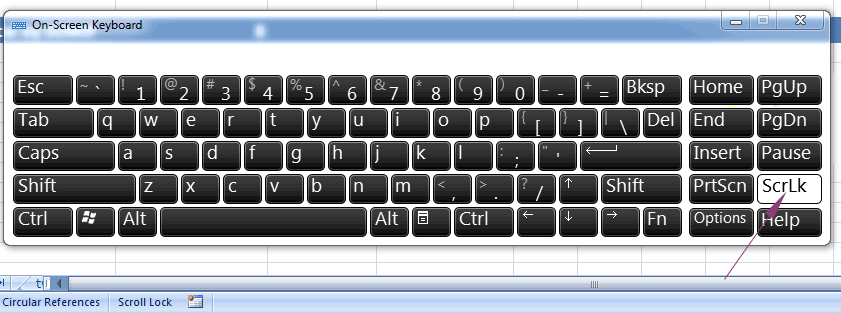
If you suddenly start seeing navigating from cell to cell is stopped while pressing the arrow keys and rather navigating in the worksheet then your scroll lock is ON.
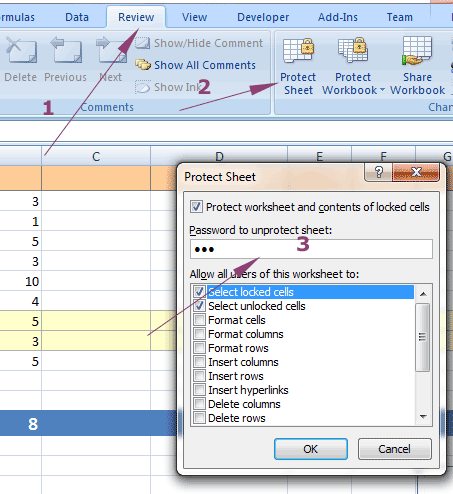
In this tutorial, you will learn how to password protect a cell, multiple cells, a row and multiple rows in MS Excel.
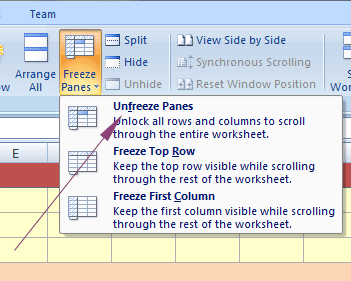
Freezing the rows or columns while working in a long workbook can be really useful. For example, the top row contains the headers of the workbook and while entering data or analyzing it
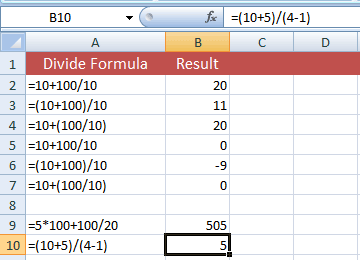
Learn Excel division with 7 formulas! Explore practical examples for efficient calculations at excel-learn.com.
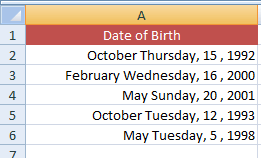
If you require displaying the date like this 2-Feb-2010 or August 1, 2015 etc. while entering dates you may change the settings in Excel easily.
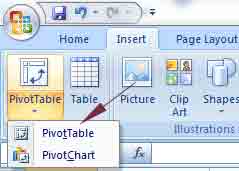
The Pivot table enables creating another table based on above table and can summarize data for analysis like averages, sum, or other useful reports. With the Microsoft Excel pivot table feature, this is the matter of few clicks
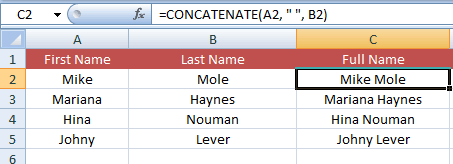
There are a numbers of ways in Excel to combine data for two or more cells in Excel. The technique and functions for merging data are:
Using CONCATENATE function
By using ‘&’ (ampersand sign)
TEXTJOIN function for merging ranges (Excel 2016, Excel online)
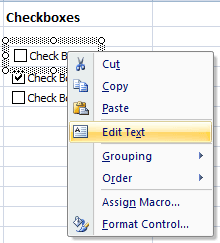
In this tutorial, I am going to show you how to create checkbox (also called tick box) in the Excel sheet. This is followed by a few examples of using it for different tables, so you can see checkboxes in action.
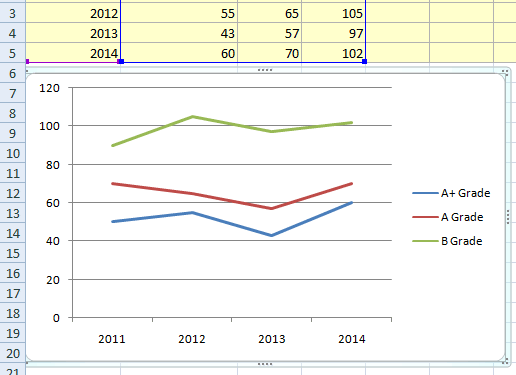
The line graph (also called line chart) is used to display the data graphically that change over the period of time.
The markers or data points in line chart are connected by the straight lines. Generally, the line charts are used for visualizing the trends over the intervals like year on year, or month on month etc.
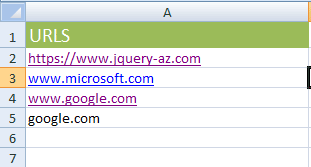
The hyperlinks are useful for linking the other sheets or files and external URLs in cells of Excel. There is a number of ways for creating the Excel hyperlinks. Let us look at these ways one by one with examples.
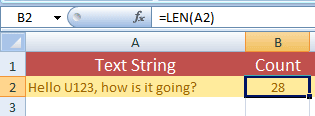
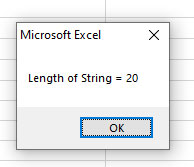
For counting the number of characters in single or multiple cells, you may use the Excel LEN function. In the LEN function, you may provide a text string, cell or use LEN with SUM function for counting characters.
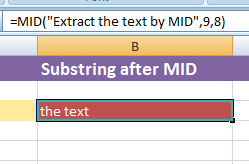
The Excel has a few functions like LEFT, MID, and RIGHT that can be used for getting the substrings from the given text, specified cell etc.